Is electricity slowing AI? SMRs, geothermal and the cost of models
AI electricity demand, Google’s SMR and geothermal deals, model training costs and energy stocks: a sourced investigation with charts and clear limits.
AI has a physical supply chain. Every new model needs chips, data, cooling and electricity. That makes a reasonable question unavoidable: could the power system become a brake on AI progress?
The evidence supports a constraint on expansion. It does not establish that electricity shortages are already causing a general decline in improvements to AI capabilities. This investigation separates three things that are often mixed together: model quality, data center electricity demand and the returns earned by energy-company shareholders.
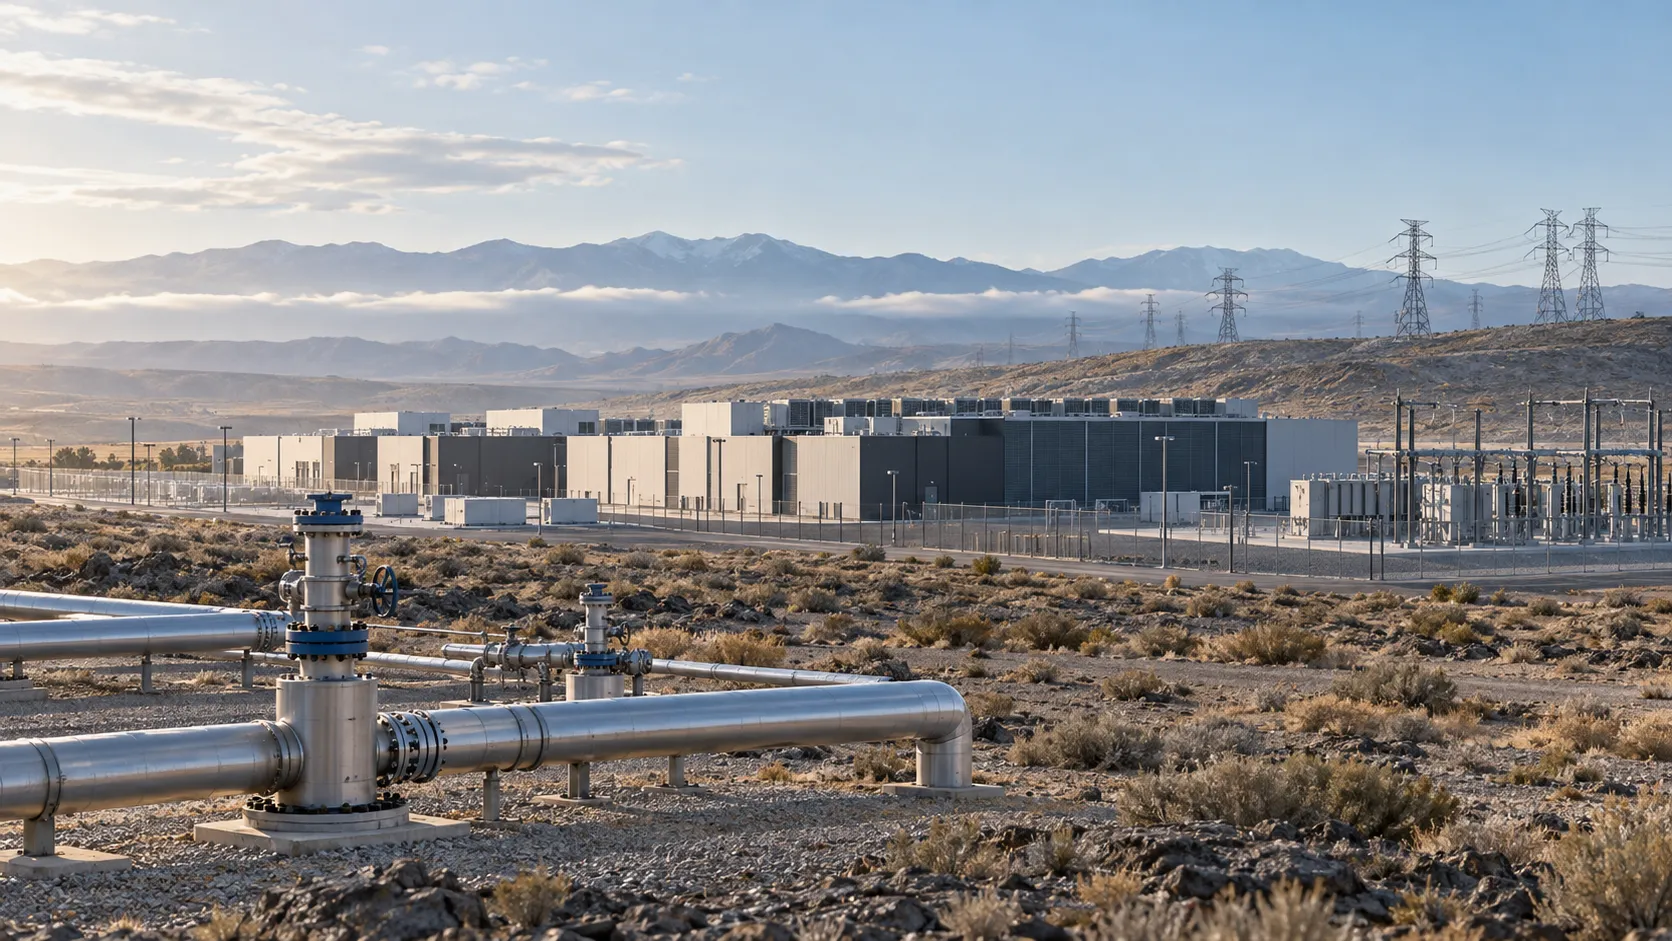
Research cutoff: 30 September 2026. Stock data ends at the 29 September close. The cover is an AI-generated editorial illustration of a fictional facility.
The constraint is local, even when demand is global
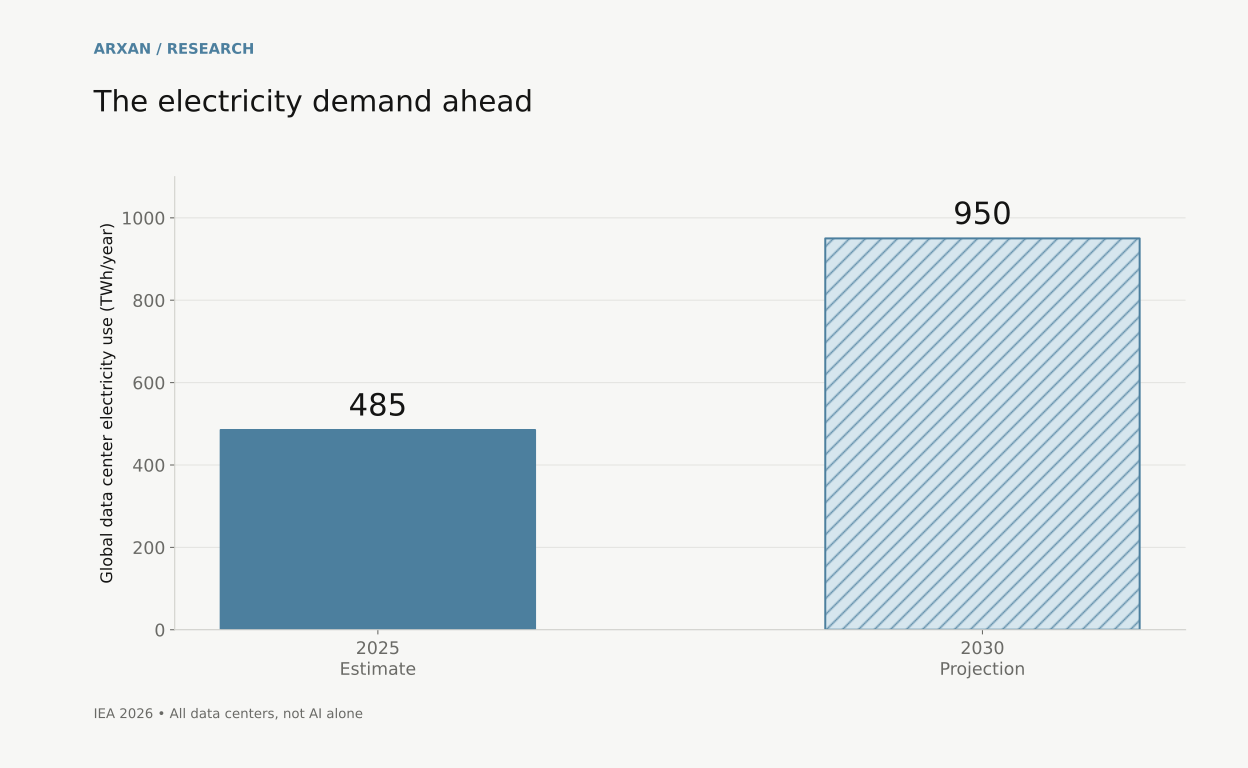
The IEA’s 2026 outlook estimates data center consumption at 485 TWh in 2025, reaching 950 TWh in 2030 in its central projection. These totals cover all data centers, not just AI. The 2030 figure is a forecast, not an observed result. IEA, 2026
The practical obstacle is delivering enough reliable power to a particular site on time. A country can have electricity available while one region lacks transmission capacity, substations or a timely grid connection. In its 2025 assessment, the IEA estimated that grid constraints could delay roughly 20% of planned global data center capacity through 2030. IEA grid analysis
That can slow deployment or raise costs. Demonstrating an effect on model quality would also require consistent capability measurements and evidence connecting specific power constraints to missed training runs. A rising electricity-demand curve alone cannot answer that question.
More parameters, more training electricity?
For dense transformer training, a common approximation is compute ≈ 6 × parameters × training tokens. Model size and dataset size both matter; neither directly measures electricity. Hoffmann et al.
Meta publishes GPU-hours for Llama 3.1 and a 700 W hardware power figure. Multiplying those hours by a uniform 0.7 kW gives a reproducible TDP-based energy proxy:
| Model | Reported GPU-hours | Calculated proxy |
|---|---|---|
| Llama 3.1 8B | 1.46 million | 1.022 GWh |
| Llama 3.1 70B | 7.00 million | 4.900 GWh |
| Llama 3.1 405B | 30.84 million | 21.588 GWh |
Inputs: Meta’s model card. Calculations: ARXAN.
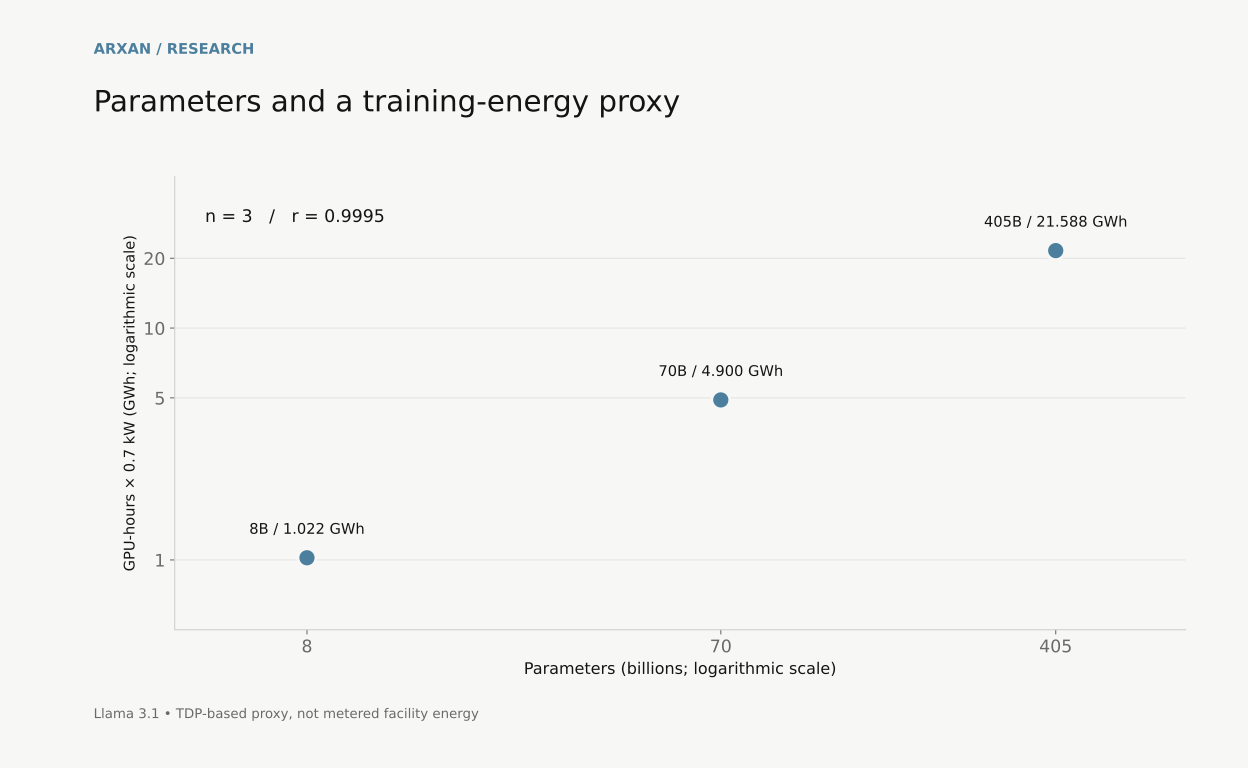
The raw Pearson correlation is r = 0.9995, with only three models. On logarithmic values it is 0.9990. The association is strong inside this small family, but three related observations cannot establish a universal energy law or causality.
Actual draw changes with utilization and hardware efficiency. CPUs, networking and cooling add consumption outside a simple device calculation. This proxy should therefore never be presented as the complete electricity bill, or as a precise upper or lower bound for the facility.
Hosting changes the equation
Training builds the model; inference runs it repeatedly. Once deployed, request volume, input length, output length, batching and idle capacity become central.
Google reported 0.24 Wh for the median Gemini Apps text prompt in its 2025 study. A median from a particular product and measurement period is not a universal per-request constant—or a mean suitable for multiplying into a fleet-wide total. Google’s measurement study
Research on inference also shows why parameter count alone is insufficient: architecture and workload change the relationship between model size and energy. From Prompts to Power
For a real comparison, measure joules per completed task at a comparable quality level, recording the hardware, precision, batch size and token counts. Report whether the meter includes only GPUs, the server or the facility. If facility energy is estimated from IT energy using power usage effectiveness, state that assumption and avoid counting cooling twice.
Efficiency can improve while total demand rises: cheaper requests can encourage more usage, longer reasoning and more autonomous tasks.
Google’s energy deals: delivered power versus promises
SMRs—small modular reactors—and geothermal electricity can supply firm power. Their contracts have different schedules and development risks.
| Project | Announced scale | What the announcement establishes |
|---|---|---|
| Google–Kairos | Up to 500 MW | First deployment targeted for 2030; further reactors through 2035 |
| Google–Fervo | 396 MW | September 2026 PPA; delivery expected in 2028 |
| Google/NV Energy–Ormat | Up to 150 MW | February 2026 announcement; projects expected in 2028–2030, subject to approval |
Sources: Google–Kairos, Fervo PPA, Ormat announcement.
Separately, Fervo reported first grid power at Cape Station on 24 September 2026. That milestone does not mean the entire Google-contracted capacity is already operating. Fervo milestone
These megawatt figures are power capacities. Annual energy depends on operating hours and output. They also cannot be summed into market shares: the deals cover different years, conditions and project boundaries.
What happened to the stocks?
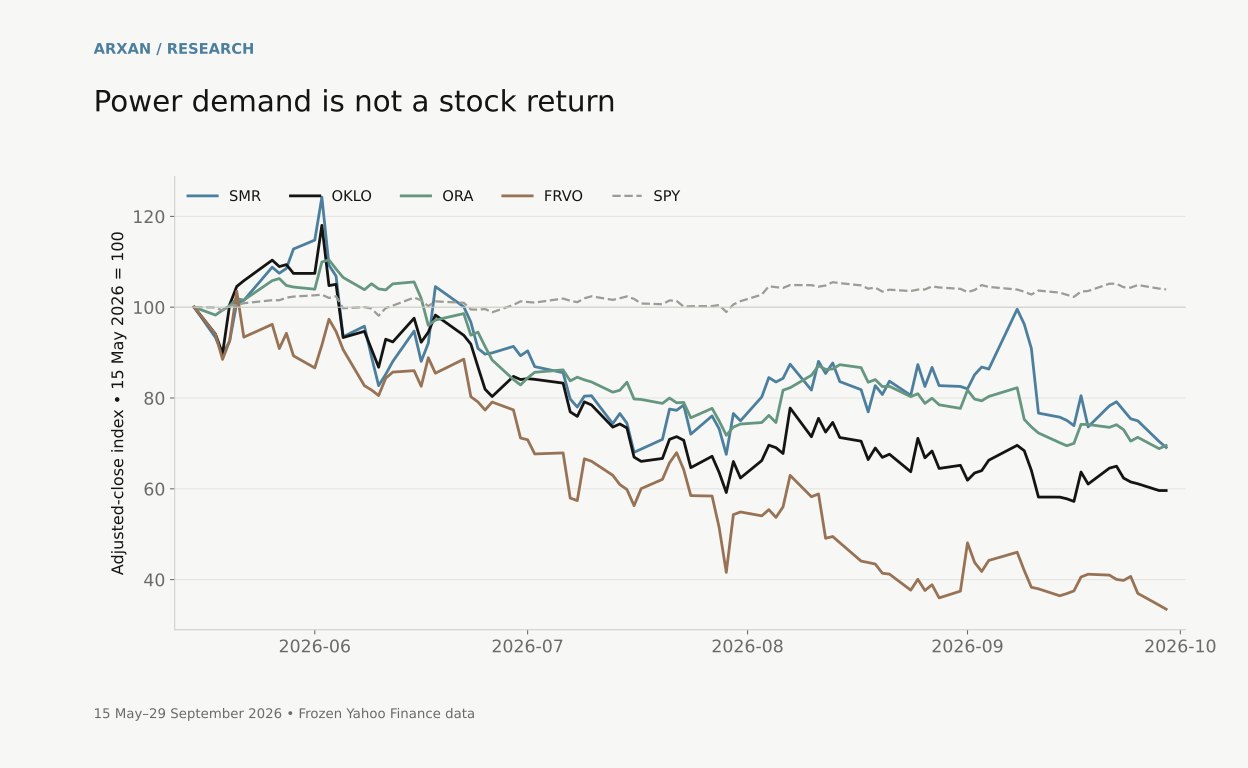
To separate the energy story from the market story, I compared SMR, OKLO, ORA and FRVO with SPY, a broad US equity-market proxy. The common window is 15 May–29 September 2026, starting after Fervo’s IPO, with 94 shared closing observations. Fervo IPO disclosure
| Security | Adjusted-close change | Largest daily-close drawdown within window |
|---|---|---|
| NuScale / SMR | −30.90% | −45.59% |
| Oklo / OKLO | −40.39% | −51.52% |
| Ormat / ORA | −30.46% | −37.66% |
| Fervo / FRVO | −66.51% | −67.65% |
| SPY | +3.91% | −4.49% |
Source: Yahoo Finance historical data; calculations from an archived daily dataset. Adjusted-close changes use the provider’s adjustments; trading costs and taxes are excluded. The sample is selected, not the whole energy sector.
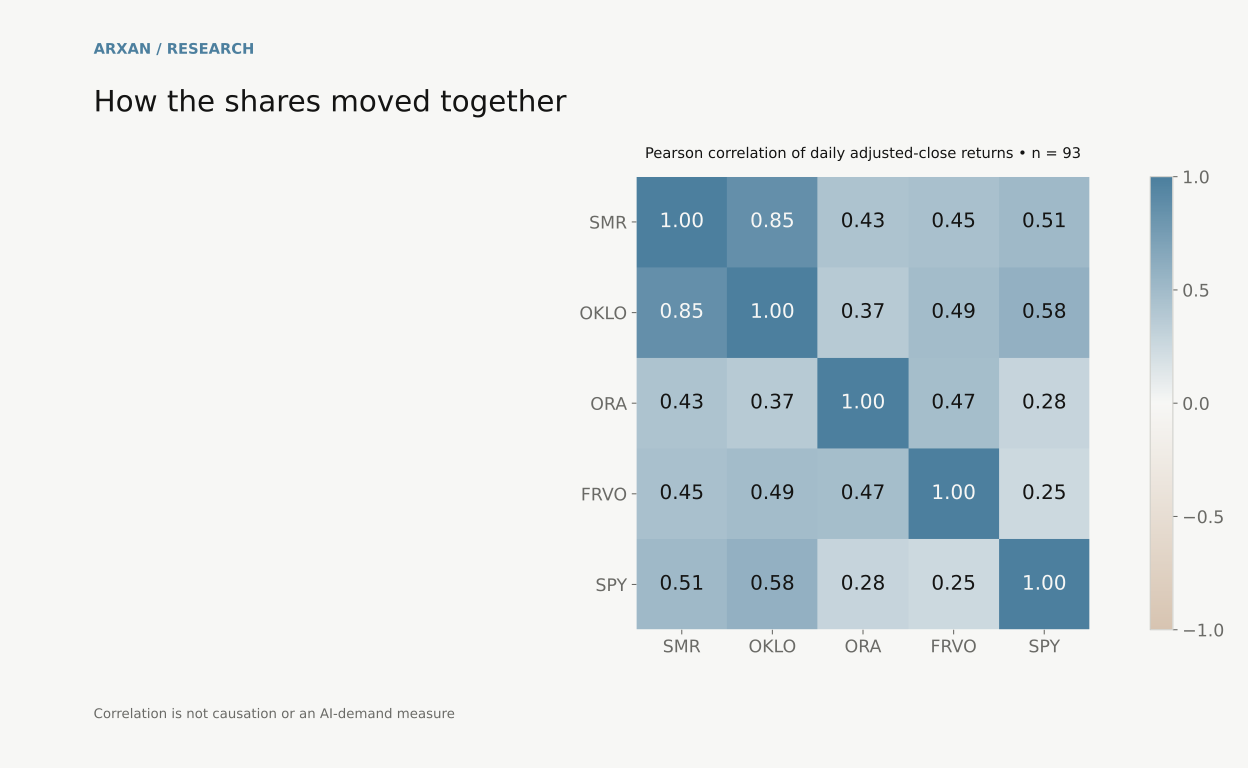
SMR and OKLO had a daily-return correlation of 0.85; ORA and FRVO, 0.47. These are descriptive relationships between securities. They do not measure correlation with AI electricity use or prove what drove prices. Valuation, financing, dilution and project execution can all matter.
The finding
Reliable electricity is a constraint on scaling AI infrastructure. The available evidence does not establish that it is causing a general slowdown in AI capability improvements.
The investment distinction is equally important: growing demand can create opportunities for energy suppliers while shareholders still lose money. Track delivered electricity, project milestones and financial outcomes separately. For AI itself, the useful efficiency target is the energy needed to complete a worthwhile task at the required quality.